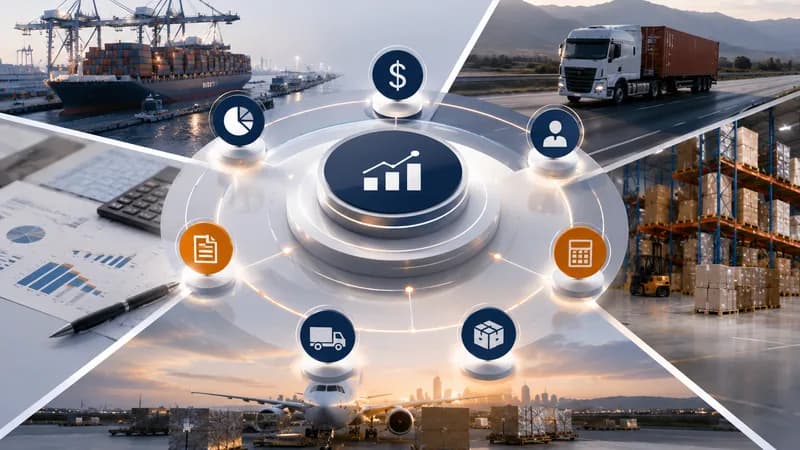
What Is a Logistics Dashboard?
A logistics dashboard is a centralized operational interface that displays real-time business information through charts, KPIs, alerts, maps, and performance indicators.
Rather than collecting data from spreadsheets, emails, and multiple software systems, logistics companies can monitor transport operations, shipment progress, fleet performance, delivery status, accounting, customer service, and financial metrics from a single dashboard.
Different departments often require different operational views. Operations teams monitor deliveries and vehicle utilization. Finance follows revenue, costs, receivables, and payables. Management focuses on profitability, workload, customer service levels, and business performance.
A centralized dashboard ensures every department works from the same operational data.
Simple definition
A logistics dashboard transforms operational data into visual insights that help businesses monitor, analyze, and improve daily logistics performance.

Why Logistics Dashboards Matter
Modern logistics operations generate thousands of operational records every day. Without a centralized dashboard, managers often spend significant time gathering information before making decisions.
Shipment delays, vehicle availability, customer requests, fuel consumption, operational costs, and financial performance all change throughout the day.
When this information is scattered across multiple systems, decision-making becomes slower, reporting becomes inconsistent, and operational issues are discovered too late.
A real-time logistics dashboard gives management immediate visibility into business performance while helping teams react faster to operational changes.
The operational challenge
The biggest challenge is not collecting data—it is transforming operational data into meaningful information that supports daily decision-making.

How Apollogix Supports Logistics Dashboards
Apollogix provides comprehensive operational dashboards through its Transportation Management System (TMS) and Freight Management System (FMS).
Apollogix TMS delivers dashboards for transport planning, dispatch management, fleet utilization, driver performance, delivery status, POD management, container tracking, accounting, operational KPIs, and executive reporting.
Apollogix FMS provides dashboards covering quotations, bookings, shipments, ocean freight, air freight, customer service, receivables, payables, profitability analysis, branch performance, and financial reporting.
Because all operational information is connected, dashboards update automatically without requiring manual consolidation.
Where the value appears
The greatest value comes from providing management with real-time visibility while reducing manual reporting across every department.

Which Businesses Benefit Most?
Logistics dashboards are valuable for transport companies, freight forwarders, warehouse operators, container carriers, customs brokers, and third-party logistics providers.
Operations teams monitor shipment execution. Finance tracks revenue, costs, receivables, and profitability. Executives gain a complete overview of operational performance through live KPI dashboards.
As logistics operations become increasingly data-driven, dashboards help businesses improve visibility, increase operational efficiency, and make faster business decisions.