A logistics dashboard system should help managers see what is happening across daily operations before small issues become larger control problems. In transport and freight forwarding, work can move through jobs, shipments, trips, drivers, vehicles, containers, services, invoices, costs, and reports. If each department updates its own file, management may see the problem too late. The keyword “he thong dashboard” should be understood as “dashboard system” or “hệ thống dashboard”, not “Thong dashboard”. For logistics companies, the real question is not whether a dashboard has charts. The question is whether the dashboard helps managers act on workload, exceptions, billing readiness, and reporting gaps.
Why Logistics Teams Need a Dashboard System
Logistics teams need a dashboard system because operational data, financial data, and pending work often sit across different departments.
The gap between daily work and management view
A logistics operation usually involves several teams. Sales may handle customer requests. Operations may manage jobs, shipments, trips, or services. Drivers or field teams may update delivery activity. Documentation may manage shipment files. Accounting may review invoices, receivables, payables, and costs. Management needs one clear picture, but each team may work from a different source.
This creates three common problems. The first problem is delayed reporting. By the time the data is collected, the job status may have changed. The second problem is missing context. A number may appear on a report, but the team may not know which job, shipment, trip, customer, vehicle, or invoice created it. The third problem is weak follow-up. If a dashboard only shows totals, managers still need to ask each department what needs action.
A logistics dashboard system should reduce these gaps. It should show workload, status, exceptions, financial readiness, and the source record behind each issue.
What a TMS Dashboard Should Track
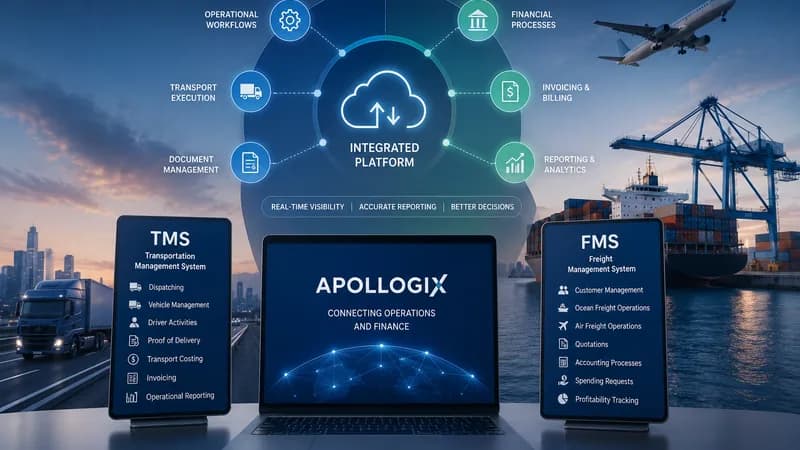
A TMS dashboard should track transport jobs, containers, trips, drivers, equipment, waiting time, delivery proof, notifications, accounting data, and reports.
Dashboard views for transport operations
TMS means Transport Management System. It is used to manage transport operations such as customer jobs, trip planning, vehicle allocation, driver activity, equipment status, and transport accounting.
For transport managers, the first dashboard view should show workload by status. This may include total jobs, containers, trips, drivers, and equipment. A manager should be able to see which jobs are new, active, delayed, completed, or waiting for the next action.
The second view should show trip activity. Managers need to understand how many trips are planned, assigned, completed, delayed, or still waiting. Trip summary views help management see the general situation by day, driver, or trip type.
The third view should show exceptions. Waiting time at ports, warehouses, or delivery points can affect service quality and cost. Container demurrage tracking is also important when containers are close to the end of free time. Delivery proof should be visible because a trip may be physically completed but still not ready for customer confirmation or billing.
The fourth view should connect with accounting. A transport dashboard becomes more useful when job status, trip activity, invoices, payments, receivables, payables, and cost data can be reviewed together.
What an FMS Dashboard Should Track
An FMS dashboard should track shipment volume, import and export workload, ocean and air activity, service workload, job order status, notifications, accounting data, and reports.
Dashboard views for freight forwarding
FMS means Freight Management System. It is used by freight forwarders to manage customer data, ocean freight, air freight, services, job orders, pricing, accounting, and reporting.
For freight forwarding managers, the first dashboard view should show shipment workload. This may include all shipments, import shipments, export shipments, and domestic activity if needed. Managers need this view to understand how much work is moving through the operation.
The second view should show transport mode structure. Freight forwarders may handle ocean freight, air freight, and express services. A dashboard should help management see how workload is distributed across these activities.
The third view should show service workload. A shipment may include customs, trucking, handling, or other logistics services. When service workload is visible, managers can see whether the team is waiting on internal action, vendor action, or customer confirmation.
The fourth view should show job order status. A job order may be active, draft, pending, or waiting for approval. If this status is not visible, accepted work may sit without follow-up.
The fifth view should show notifications. New shipment creation, job order approval, and new service creation should lead users to the related detail screen without unnecessary searching.

How Dashboard Data Should Connect With Accounting
Dashboard data should connect with accounting because logistics work is not fully controlled until invoices, receivables, payables, costs, and profit can be reviewed with operational context.
Why operational completion is not enough
A shipment may be active, but billing may not be ready. A trip may be completed, but proof of delivery may still be missing. A service may be finished, but the related cost may not be attached to the job. These gaps create risk for both operations and finance.
For transport operations, accounting data should connect with transport jobs, trip activity, rates, invoices, payments, receivables, payables, and reports. This helps managers understand whether a completed transport activity is also ready for financial review.
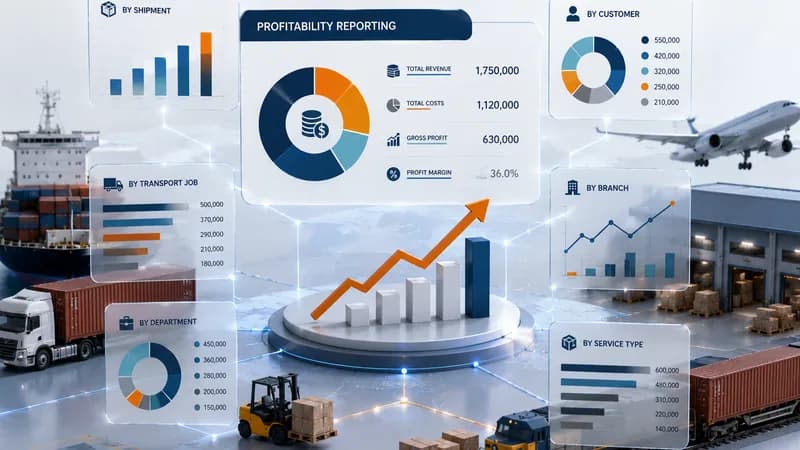
For freight forwarding operations, accounting data should connect with job orders, shipments, services, spending requests, invoices, receivables, payables, revenue, costs, and profit by job or shipment. This helps managers see whether shipment activity is financially complete or still waiting for missing data.
A dashboard that only shows operational volume is not enough for management. Leaders need to know which files are active, which files are delayed, which files are ready for billing, and which files still have cost or invoice gaps. This is where the dashboard becomes a control view, not only a reporting screen.
Which Dashboard Views Should Managers Review First
Managers should review workload status, exception status, accounting readiness, and reporting completeness before looking at general charts.
The first views that matter
The first view is workload status. For transport companies, this includes jobs, containers, trips, drivers, vehicles, trailers, and equipment. For freight forwarders, this includes shipments, import and export workload, ocean and air activity, service workload, and job order status.
The second view is exception status. For transport operations, exceptions may include waiting time, demurrage risk, missing delivery proof, equipment issues, or delayed trips. For freight forwarding, exceptions may include draft shipments, pending job orders, service delays, missing documents, or accounting handover points.
The third view is accounting readiness. Managers should review whether completed work has created the right invoice, receivable, payable, cost, and profit records. A job can look complete from an operations view while still being incomplete from a finance view.
The fourth view is reporting completeness. If teams still rebuild weekly or monthly reports by hand, the dashboard is not yet connected deeply enough with the workflow.