Logistics operations become harder to manage when every department measures performance in a different way. Operations may track job progress. Customer service may track delivery updates. Finance may track invoice readiness. Management may ask for shipment volume, cost status, revenue, profit, and exceptions. When these numbers come from separate files or manual reports, leaders may receive the information too late. A logistics KPI dashboard system helps companies turn daily operating data into a shared management view. KPI means key performance indicator. In logistics, KPI tracking helps leaders understand whether jobs, shipments, trips, services, costs, and invoices are moving as expected.
Why Logistics KPI Tracking Needs a Dashboard
Logistics KPI tracking needs a dashboard because operational performance, financial readiness, and service exceptions must be reviewed from connected data.
The problem with delayed performance reports
A logistics company usually handles many activities at the same time. A transport team may manage jobs, trips, vehicles, drivers, containers, and delivery updates. A freight forwarding team may manage shipments, services, documents, customer records, costs, and invoices. Finance may need to know whether costs are confirmed and whether billing can begin.
When KPI data is collected manually, reports often arrive after the problem has already affected the operation. A delivery may be delayed. A proof of delivery may be missing. A service may still be pending. A cost may not be confirmed. An invoice may be blocked. If management only sees these issues after manual consolidation, the business loses time.
A dashboard gives management a faster way to review performance. It does not replace detailed records. It creates a control layer where leaders can see workload, status, delays, financial readiness, and exceptions before checking each file.

What KPIs Should Logistics Operations Track?
Logistics operations should track workload, job progress, delivery status, waiting time, document readiness, cost readiness, billing readiness, revenue, cost, profit, and exceptions.
Operational workload and job progress
The first KPI group is workload. Management needs to see how many jobs, shipments, containers, trips, services, drivers, and vehicles are active within a selected period. Workload data helps leaders understand whether the team is operating within normal capacity or starting to face pressure.
The second KPI group is job progress. This may include transport job status, shipment status, trip status, service progress, and delivery progress. These indicators help teams see where work is moving and where it is waiting for the next action.
The third KPI group is delivery status. Logistics work is not complete only because a vehicle has moved or a shipment has been created. The company may still need delivery confirmation, proof of delivery, service completion, document readiness, and customer update.
The fourth KPI group is waiting time and exception tracking. Waiting time at ports, warehouses, or delivery points can affect cost and service performance. Exceptions may include delayed jobs, missing documents, pending costs, blocked services, overdue invoices, or files waiting for customer response.
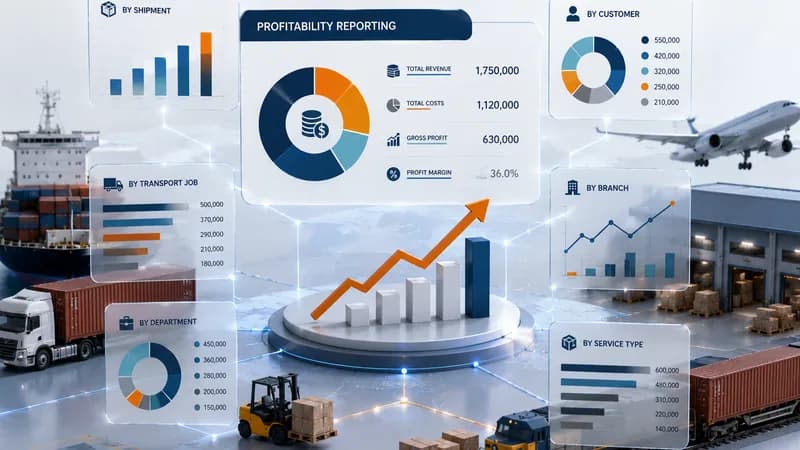
The fifth KPI group is financial readiness. Management should see whether costs are confirmed, whether invoices are ready, whether receivables and payables need action, and whether job-level profit can be reviewed.
How a KPI Dashboard Connects Operations and Finance
A KPI dashboard connects operations and finance by showing how job progress, service completion, cost confirmation, invoice status, and profit review affect each other.
Why operational data must connect with financial data
In logistics, operational completion and financial completion are not always the same. A trip may be delivered, but proof of delivery may not be uploaded. A shipment may be completed, but vendor costs may still be pending. A service may be done, but the customer charge may not be ready for billing.
This gap creates pressure for both operations and finance. Operations may believe the job is complete. Finance may still need cost confirmation before issuing invoices or reviewing profit. Management may see workload volume but not know whether the work is financially ready.
A KPI dashboard helps connect these views. For operations, it shows job status, shipment status, trip progress, waiting time, and service workload. For finance, it shows cost readiness, billing readiness, receivables, payables, revenue, cost, and profit. For management, it shows whether the operation is only busy or actually under control.
When the same dashboard connects these data points, leaders can review performance with clearer context. They can see not only what happened, but also what remains unfinished.

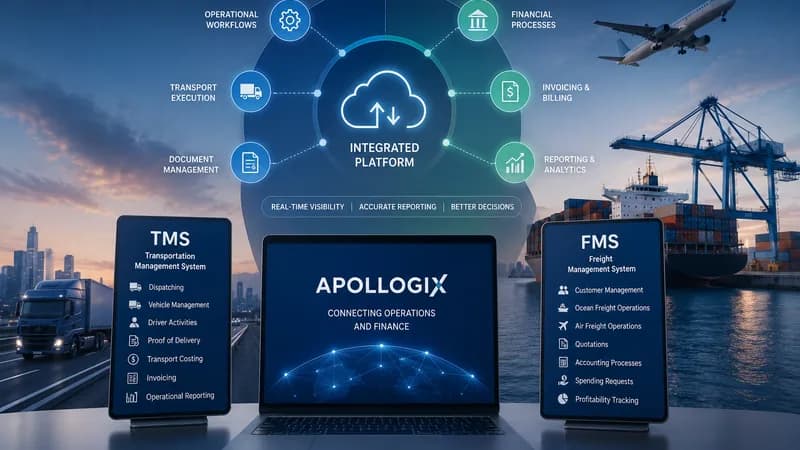
How Apollogix Supports Logistics KPI Dashboards
Apollogix supports logistics KPI dashboards through connected workflows for transport operations, freight forwarding, accounting, dashboard views, and reporting.
KPI visibility in transport operations
Apollogix TMS supports transport management workflows such as transport jobs, operation planning, trip allocation, driver updates, equipment management, waiting time, proof of delivery, accounting, and reports. These workflows help transport teams monitor jobs, containers, trips, drivers, vehicles, trailers, delivery status, waiting time, costs, invoices, receivables, payables, and operating performance.
For transport managers, this gives a clearer way to review daily activity. They can understand which trips are moving, which jobs are waiting, which equipment needs attention, and which delivery records may affect billing or customer updates.
KPI visibility in freight forwarding
Apollogix FMS supports freight forwarding workflows such as customer management, ocean freight, air freight, services, sales, job orders, pricing, accounting, spending requests, dashboard views, and reports. These workflows help freight forwarding teams review shipment volume, service progress, customer activity, cost readiness, billing readiness, revenue, cost, profit, and exceptions.
For freight forwarding managers, this matters because shipment work often crosses sales, documentation, operations, service, and accounting. A connected dashboard helps each team work from the same operational picture.
What Leaders Should Check Before Choosing a KPI Dashboard
Leaders should check whether the KPI dashboard uses real workflow data, consistent KPI definitions, role-based access, exception tracking, and reports that support management review.
Questions before implementation
The first question is whether each KPI has a clear definition. Terms such as completed job, delayed shipment, billing ready, pending cost, and proof of delivery received should mean the same thing across departments.
The second question is where the dashboard data comes from. A reliable dashboard should use data from jobs, shipments, services, drivers, vehicles, documents, cost records, invoice records, receivables, payables, and reports. If the dashboard depends on manual updates, the risk of outdated information remains.
The third question is whether the dashboard supports traceability. A useful KPI view should allow users to move from a summary number to the related job, shipment, service, customer, driver, vehicle, invoice, or cost record.
The fourth question is whether the dashboard highlights exceptions. Management should not only see totals. They should also see delayed work, blocked files, missing data, pending costs, and billing risks.
The fifth question is whether reporting helps different roles. A COO may need operational pressure and service performance. A CFO may need cost readiness, billing readiness, receivables, payables, and profit. A dashboard should support both views without forcing teams to rebuild reports manually.