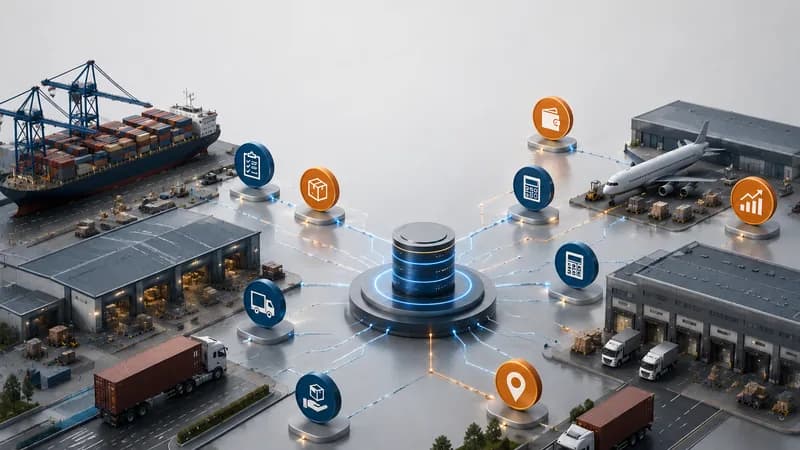
A logistics operations KPI dashboard tracking system helps logistics companies monitor operational performance through structured dashboard and reporting views. It helps managers review jobs, shipments, trips, drivers, equipment, services, invoices, revenue, costs, profit, billing readiness, workload, and exceptions from connected records. In logistics, KPI tracking should not be limited to a list of numbers. Each KPI should connect with the operational workflow behind it, such as a transport job, shipment, service record, driver update, equipment status, invoice, receivable, payable, or report. When KPI data is scattered across spreadsheets and department updates, management may see results too late and miss the reason behind delays, cost pressure, or billing gaps.
What Is a Logistics Operations KPI Dashboard Tracking System?
A logistics operations KPI dashboard tracking system is a reporting system that helps logistics teams track operational and financial performance indicators across transport, freight forwarding, accounting, and management workflows.
KPI Tracking for Logistics Operations
KPI tracking in logistics should help managers understand how work moves through the company. Useful KPIs may include job volume, shipment volume, trip status, driver workload, vehicle usage, waiting time, service workload, invoice status, revenue, cost, profit, receivables, payables, and pending actions. These KPIs are useful when they are connected to the records that created them.
Core KPI Groups to Review
The core KPI groups should include operations status, workload, delivery progress, equipment readiness, billing readiness, cost control, revenue performance, profit review, customer activity, route activity, and exceptions.
Why Dashboard Context Matters
A dashboard number is not enough if managers cannot understand the source behind it. For example, a high number of completed trips may still hide missing proof of delivery. A shipment volume report may look positive while several files are not ready for billing. A cost report may show higher spending, but management still needs to know which job, route, vendor, or service created the cost.
Why Do Logistics Companies Need KPI Dashboard Tracking?
Logistics companies need KPI dashboard tracking because manual reporting creates delayed visibility, inconsistent data, unclear responsibility, and weak control over daily operations.
Manual KPI Tracking Creates Reporting Gaps
Many logistics teams still prepare KPI reports through spreadsheets, email updates, and manual summaries from each department. This creates several issues. The data may be updated at different times. The same job may be counted differently by operations and accounting. A completed shipment may not be financially complete. Management may spend more time checking data than reviewing performance.
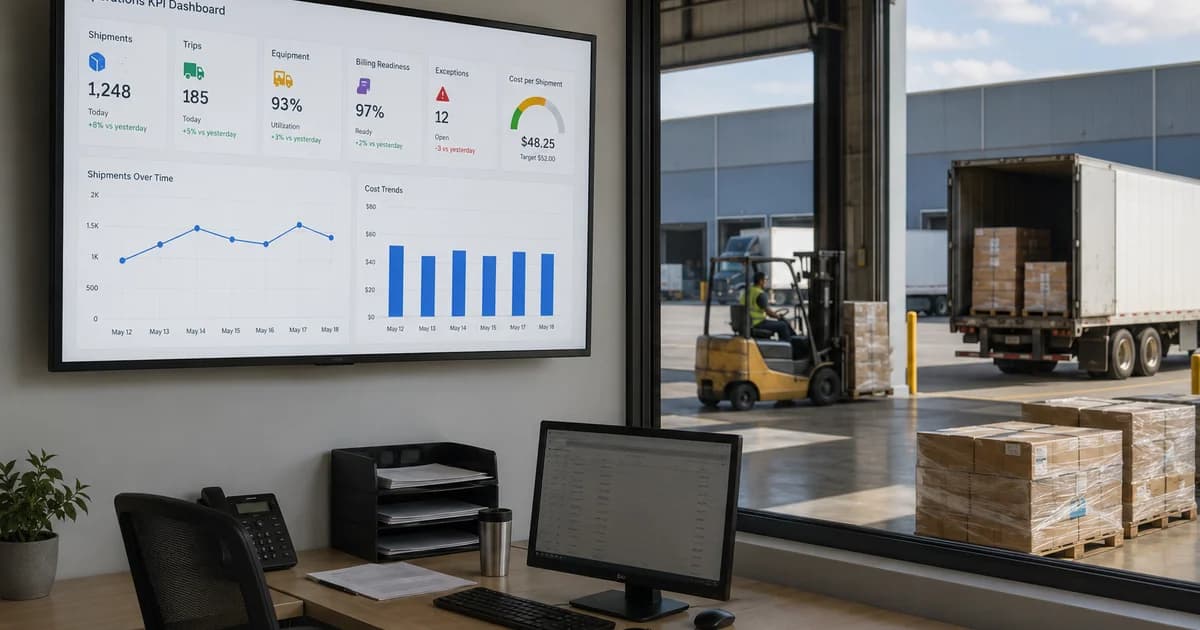
KPI Dashboards Support Faster Management Review
A structured dashboard helps managers review what is happening without waiting for each department to prepare a separate report. Leaders can check active jobs, pending shipments, trip progress, service workload, invoice readiness, cost pressure, revenue, profit, and exceptions from a connected reporting view.
KPI Tracking Helps Teams Find Bottlenecks
KPI tracking should help teams see where work is slowing down. The bottleneck may be in dispatch planning, shipment documentation, service completion, proof of delivery, cost confirmation, invoice creation, receivable follow-up, or equipment readiness. A good dashboard should make these workflow gaps visible.
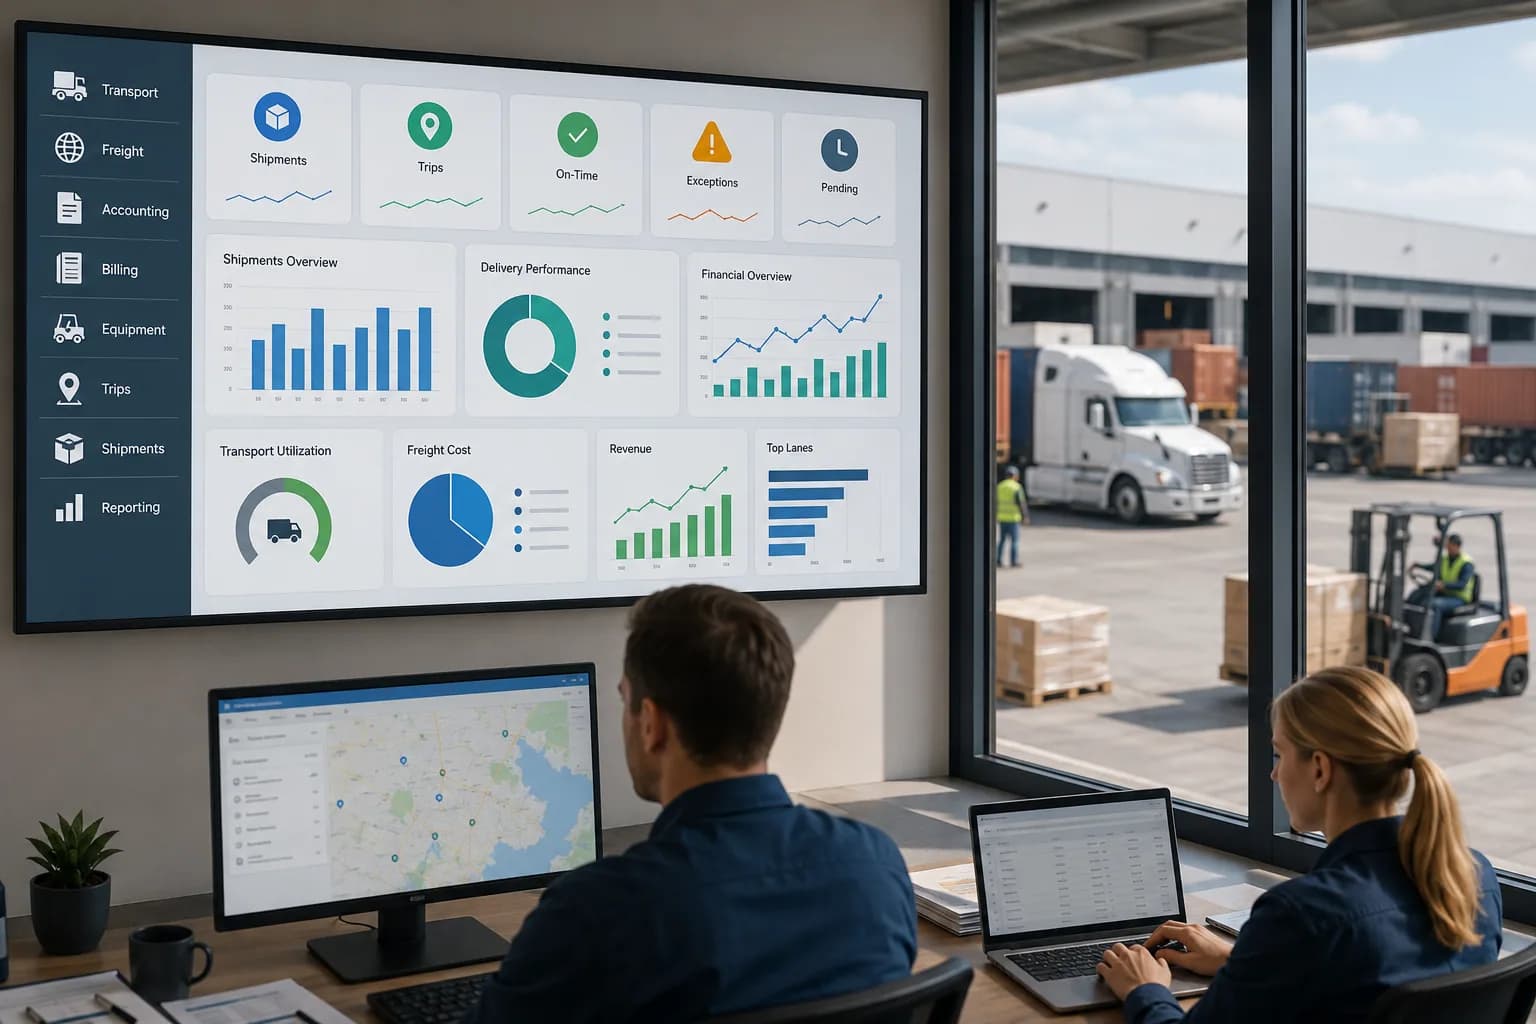
What KPI Groups Should the Dashboard Include?
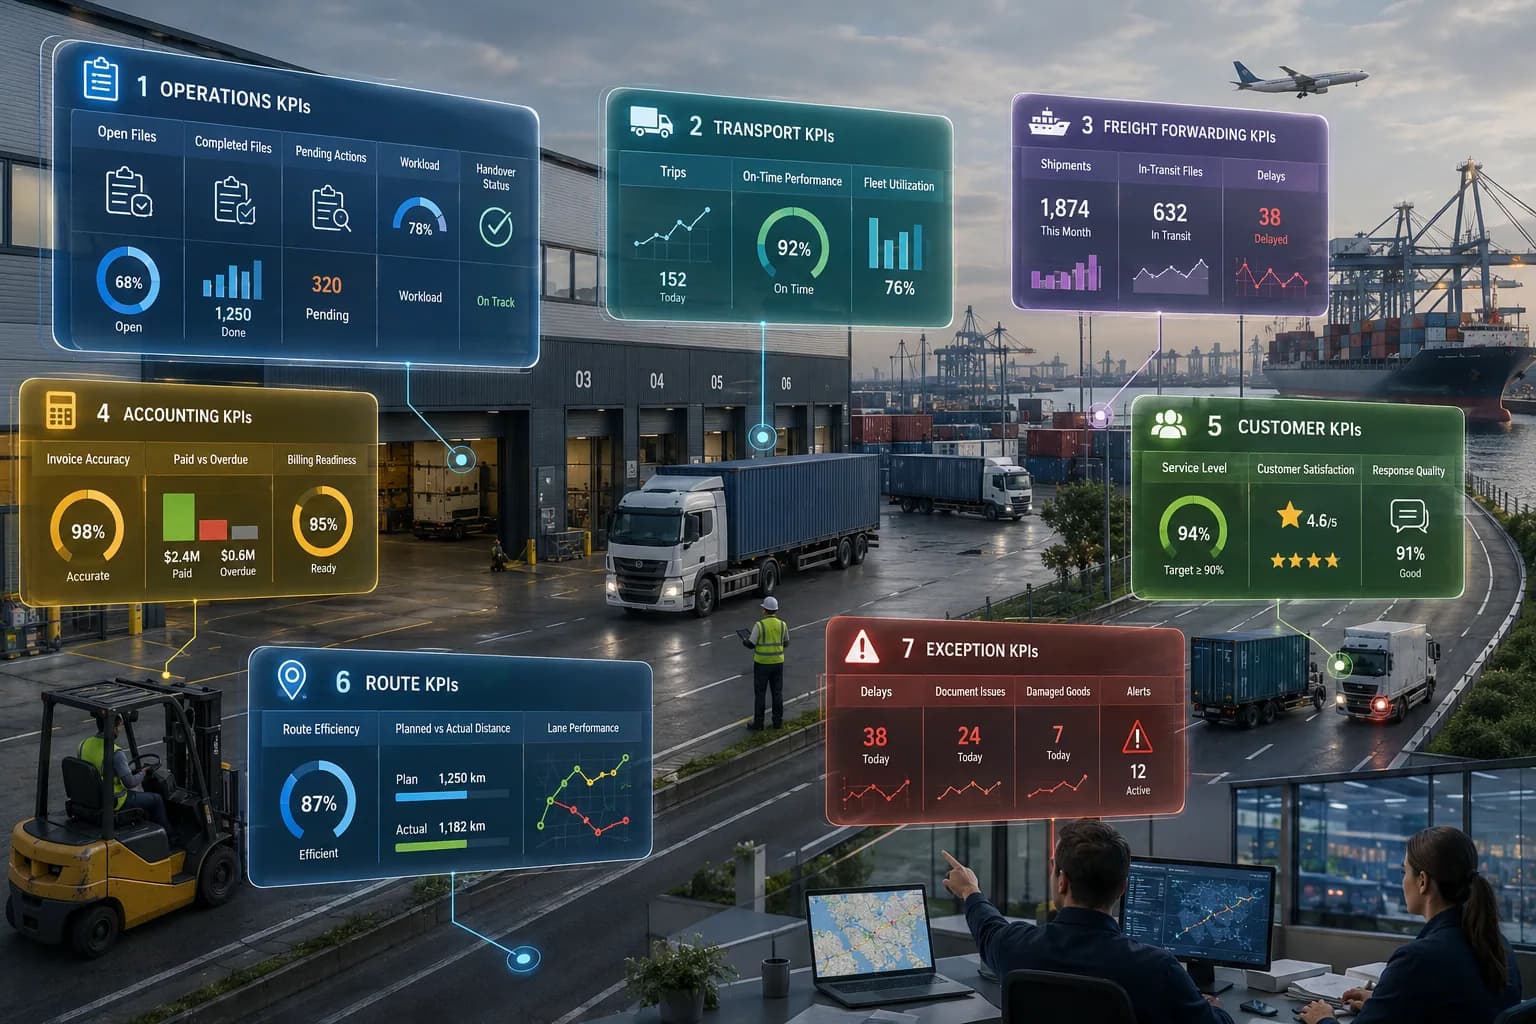
A logistics operations KPI dashboard should include operations KPIs, transport KPIs, freight forwarding KPIs, accounting KPIs, customer KPIs, route KPIs, and exception KPIs.
Operations KPIs
Operations KPIs should help managers review job status, open files, completed files, pending actions, service workload, handover status, and workload by team. These indicators help management understand whether daily operations are moving normally or waiting for action.
Transport KPIs
Transport KPIs should include transport job volume, trip progress, driver workload, vehicle usage, trailer usage, waiting time, failed trips, proof of delivery status, equipment readiness, and route performance. These indicators help transport teams review daily execution and dispatch efficiency.
Freight Forwarding KPIs
Freight forwarding KPIs should include shipment volume, job order status, ocean freight workload, air freight workload, service workload, shipment status, customer activity, route activity, revenue by customer, revenue by route, cost by job, and profit by shipment or job.
Accounting KPIs
Accounting KPIs should include invoice status, billing readiness, accounts receivable, accounts payable, payment status, spending requests, revenue, costs, profit, and files waiting for cost confirmation. These KPIs help management connect operational completion with financial readiness.
How Does Apollogix Support Logistics KPI Dashboard Tracking?

Apollogix supports logistics KPI dashboard tracking through connected TMS and FMS workflows for dashboard, transport jobs, operations, equipment management, driver updates, ocean freight, air freight, services, accounting, and reports.
Apollogix TMS for Transport KPI Tracking
Apollogix TMS supports transport jobs, operations, driver updates, equipment management, accounting, dashboard, and reporting. This helps transport teams review job volume, trip status, driver activity, vehicle and trailer usage, waiting time, proof of delivery, invoice status, costs, receivables, payables, and operational exceptions.
Apollogix FMS for Freight Forwarding KPI Tracking
Apollogix FMS supports client management, ocean freight, air freight, services, sales, job orders, pricing, accounting, spending requests, dashboard, and reports. This helps forwarding teams review shipment volume, job order status, service workload, customer activity, route activity, revenue, cost, profit, invoices, receivables, payables, and spending requests.
Dashboard and Reporting for Management
Dashboard and reporting workflows help management review performance from connected operational and accounting records. Instead of rebuilding reports manually, managers can review updated data from transport jobs, shipment files, services, invoices, cost records, and reports.
What Should Leaders Check Before Choosing a KPI Dashboard System?
Leaders should check whether the dashboard connects KPI numbers with real logistics records, not only whether it displays charts.
Check Data Connection
The dashboard should connect jobs, shipments, trips, services, drivers, vehicles, trailers, invoices, costs, receivables, payables, customers, routes, and reports. If teams still need to copy data from several files, the dashboard is not connected enough.
Check KPI Relevance
The dashboard should show KPIs that support daily management decisions. A logistics company may need KPIs for job status, shipment status, trip progress, waiting time, billing readiness, cost readiness, revenue, cost, profit, and exceptions.
Check Reporting Consistency
The same job, shipment, trip, invoice, or cost item should not be counted differently across departments. A good KPI dashboard should help teams work from the same source of data.
Check Exception Visibility
The dashboard should show which records need action. Exceptions may include delayed trips, missing proof of delivery, pending service records, invoices not created, missing cost confirmation, overdue receivables, or unavailable equipment.
When Does a Logistics Company Need KPI Dashboard Tracking?
A logistics company needs KPI dashboard tracking when job volume, shipment activity, transport execution, service workload, billing follow-up, cost control, and management reporting become difficult to monitor manually.
Manual Reports Take Too Long
If KPI reports require manual consolidation from spreadsheets, emails, and department updates, the company needs a structured dashboard and reporting workflow.
Management Cannot See Workflow Bottlenecks
If management knows that performance is slowing down but cannot see whether the issue is in operations, dispatch, documentation, service completion, or accounting, KPI tracking needs better workflow connection.
Billing and Cost Review Are Delayed
If completed jobs or shipments are not ready for billing because cost, service, proof of delivery, or invoice records are missing, the dashboard should track billing readiness and cost readiness.
Teams Need One Performance View
If operations, finance, and management use different reports to review the same work, the company needs one connected performance view to improve control and reporting consistency.